About the Mask Data Explorer
Data by Kirschvink Group & Explorer by Michael Batchev
How we measure mask efficiency
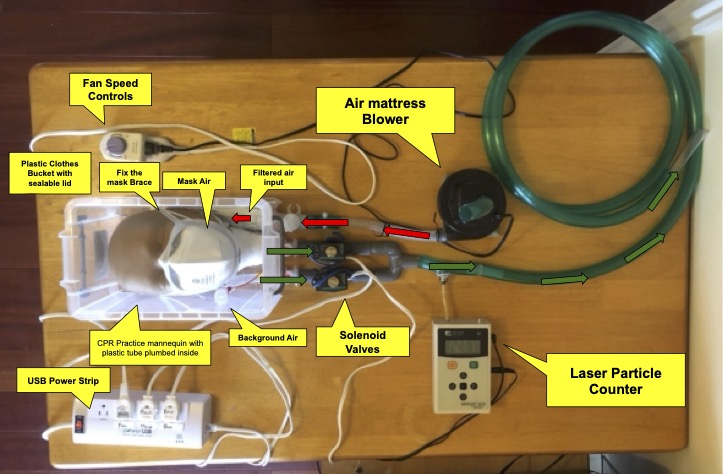
Our measurements are centered around commercially-available laser particle meters that are normally used to monitor the numbers of dust and aerosol particles down to about 0.3 um in size. This is well within the size of particles thought to carry most aspirated particles of the SARS-COV 2 virus. We use a MetOneTM Aerocet 531S from our magnetically-shielded clean lab because we had already debugged software for controlling it for other experiments. This reports data in bins >= 0.3, 0.5, 1.0 and 5.0 um sizes, with calibration traceable to NIOSH standards (according to the manufacturer). Typical units sell in the (US)$1600 range. To measure filtration efficiency through a mask with this meter, we took a Styrofoam mannequin ‘wig model’ head and mated it with the plastic head of a CPR dummy, using hot melt adhesive to hold them together. To give the skin around the front of the face, cheeks and jaw a soft ‘bounce’ similar to that of natural human skin we put a layer of 2 mm thick sticky foam window sealing tape over the front of the dummy’s face, and positioned one of the replaceable rubber face coverings for the unit over this (see figure). We then used a hot copper pipe to ‘melt’ away the Styrofoam for a flexible plastic tube that sealed completely around the mouth and was plumbed into an easily-removable fixture in the center of the neck. This allows for easy removal. Any leaking spots were sealed with hot glue. This assembly was placed into a plastic box with a lid, which was modified by an air mattress blower that could be controlled with a simple electrical lamp dimmer and power meter. An identical flexile tube of equal length was plumbed into the box alongside the connection to the mannequin for comparison. This provides a ‘mask’ port that samples air flowing through the masks, and a ‘box’ port that samples the background air for comparison. The tubes connecting the mask and box ports were controlled by a pair of ¾” solenoid valves that were plumbed through a Y adaptor to feed into a single tube. The laser particle meter monitored the air flowing through this assembly, adjusted to a flow rate of about 30 liters per minute. (This is much less than the NIOSH protocol, but more comparable to every-day use by most people). A computer-controlled (USB) power strip was programmed to turn on the blower motor and open both solenoid valves for a 30 second flush-out period. We then alternated between monitoring the air through the box port, and mask port, box port, etc., for a total of 7, 70-second long measurements, 4 of the baseline values in the box and 3 of the air actually flowing through the masks. The 70 seconds includes a 10-second flush-out interval to purge the plumbing of the air from the previous measurement. Data were saved as a CSV file, and the controlling software then automatically converted to an Excel spreadsheet that calculated the filtration efficiencies for particles in the 0.3-0.5, 0.5 – 1.0, and 1.0-1-5 um size bins (although the number counts for the latter were usually too small for meaningful comparisons). A complete measurement takes about 10 minutes.
How to interpret our data
Our goal here is to measure the intrinsic filtration of the various masks, and not the ‘natural’ fits that vary from person to person depending on how well the masks fit. For this, we sealed the masks to the mannequin head using a ‘Fix the Mask’ brace made of silicon rubber, which was easy to use for sealing the masks to the dummy, including around the bridge of the nose. (In earlier versions, we used plastic kitchen wrap to make similarly-good seals.) It is important to note that our data represent the material filtration efficiency of each mask. This means that in our testing rig, we ensure that every mask forms a perfect fit with the test dummy’s head. This way all of our data can be uniform and easy to interpret. In the real world, however, the fit of a mask is also very important in the overall efficiency of a mask. Even the best mask will have reduced effectiveness if the straps are left loose, or if it does not seal completely around the face. On the other hand, you cannot achieve any filtration efficiency better than the material is intrinsically capable of achieving, which is what we are measuring here. A mask that only filters 30% of these particles will never compare to some of the surgical style masks, or the medical-grade N95s and KN95 that can be upwards of 98% efficient through the use of electrically-charged propylene microfibers.
Donate to help our work!
You can donate through the Caltech donation service to help us test more masks with better precision!
Find out how to donate!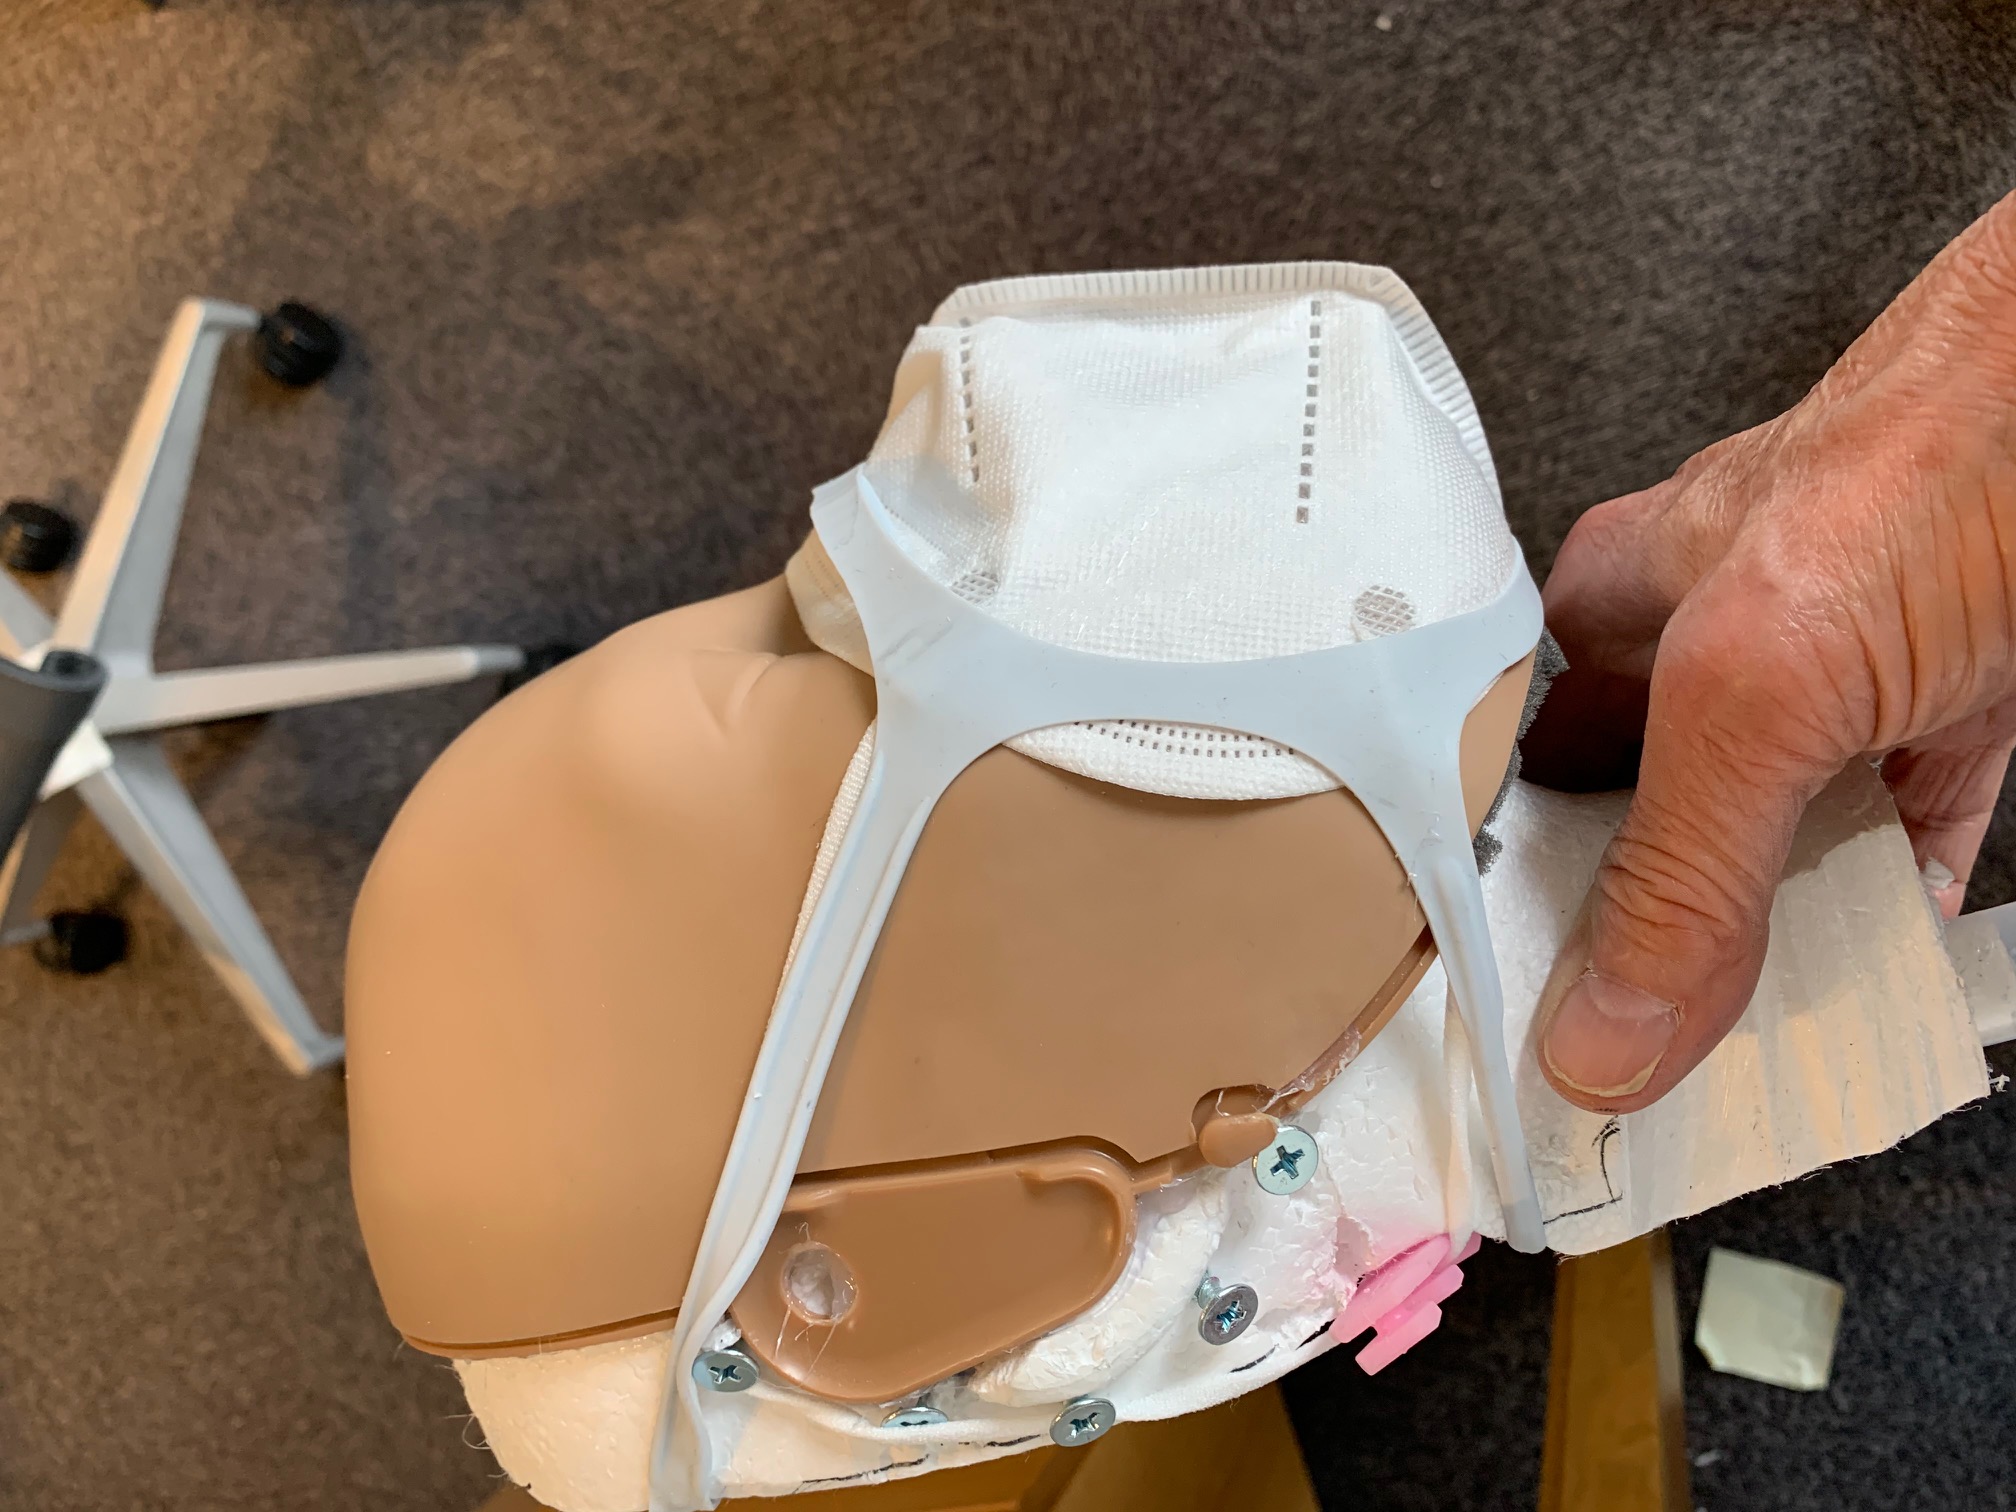
The test method used here and data collected therefrom have not been reviewed, cleared, or approved by NIOSH, FDA, or any other regulatory authority. Neither the California Institute of Technology (“Caltech”) nor its employees or agents provide any representation or warranty, express or implied, for fitness for a particular purpose, safety, or efficacy. Caltech offers these data for informational purposes only. Mention of specific products by name does not constitute an endorsement or recommendation for use by Caltech.